
Normal vs Inferior Goods, Substitutes, Complements, and Market Demand
Why does your demand for branded shoes rise after a pay hike, while demand for the cheapest local slippers might actually fall? Why does a price hike in coffee push more people toward tea? These questions sit at the heart of demand theory — a high-yield topic in Class 11 Economics. This post covers demand, normal and inferior goods, substitutes and complements, and how individual demand curves combine into market demand.
What Is Demand?
Demand for a commodity is the quantity a consumer is both willing to buy and able to afford, given prices and her income. Merely wanting something isn’t demand unless you can actually pay for it.
The Demand Function and Demand Curve
The demand function shows how the quantity a consumer chooses depends on price, assuming income, other prices, and tastes stay constant:
X = f(P)
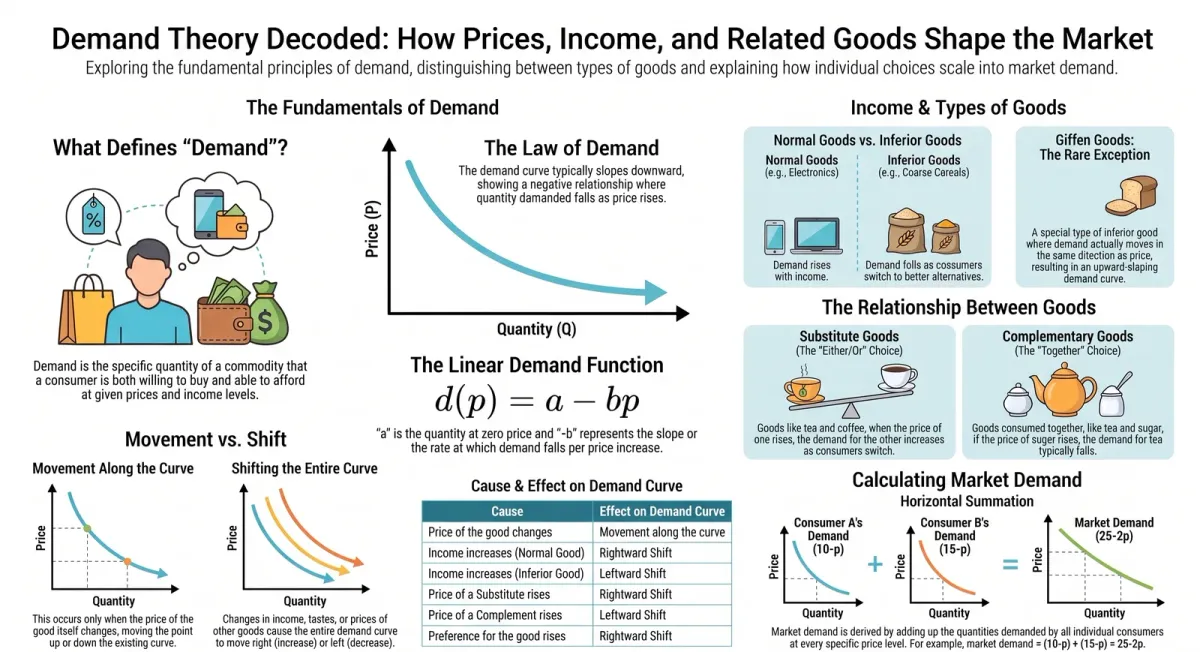
Plotted graphically, this becomes the demand curve, with price on the vertical axis and quantity on the horizontal axis. As established in our previous post on consumer’s equilibrium, this curve typically slopes downward — this negative price-quantity relationship is the Law of Demand.
Linear Demand Function
A simple linear demand curve can be written as:
d(p) = a − bp
Here, a is the quantity demanded at zero price, where the curve meets the quantity (horizontal) axis, and b is how much quantity demanded falls for every one-rupee rise in price. Because price is on the vertical axis, the curve meets it at p = a/b, and the line as drawn has slope −1/b.
Normal Goods vs Inferior Goods
Beyond price, a consumer’s income also affects how much of a good she buys — but not always in the same direction.
Normal Goods
A normal good is one whose demand increases as the consumer’s income increases, and decreases as income falls. Most goods you buy — clothes, electronics, restaurant meals — fall into this category, since demand moves in the same direction as income.
Inferior Goods
An inferior good is one whose demand decreases as income rises, and increases as income falls. A classic example is low-quality or coarse cereals — as people earn more, they switch to better-quality alternatives, reducing consumption of the inferior option.
A good can be normal at low income levels and inferior beyond a certain threshold — demand for cheap cereals might rise initially with income, then fall once the consumer can afford better food.
Giffen Goods: The Exception to the Rule
A Giffen good is a rare case where demand moves in the same direction as price — its demand curve is upward sloping. This happens when the negative income effect of a price change (from being an inferior good) is strong enough to outweigh the usual substitution effect.
Substitutes and Complements
Goods don’t exist in isolation — the price of one good can significantly affect the demand for another, depending on their relationship.
Substitute Goods
Substitutes are goods that can replace one another, such as tea and coffee. If coffee’s price rises, consumers shift toward tea, increasing its demand. Demand for a good moves in the same direction as the price of its substitute.
Complementary Goods
Complements are goods consumed together, such as tea and sugar, or shoes and socks. If sugar’s price rises, people may cut back on tea too, decreasing its demand. Demand for a good moves in the opposite direction of the price of its complement.
Movement Along vs Shift of the Demand Curve
This distinction trips up many students, so let’s be precise:
-
A change in the price of the good itself causes a movement along the same demand curve (up or down the existing curve).
-
A change in any other factor — income, prices of related goods, or consumer preferences — causes the entire demand curve to shift (left or right).
| Cause | Effect |
|---|---|
| Price of the good changes | Movement along demand curve |
| Income increases (normal good) | Curve shifts rightward |
| Income increases (inferior good) | Curve shifts leftward |
| Price of a substitute rises | Curve shifts rightward |
| Price of a complement rises | Curve shifts leftward |
| Preference for the good rises | Curve shifts rightward |
Deriving the Market Demand Curve
So far, we’ve discussed a single consumer’s demand. But real markets have many buyers. Market demand for a good at a given price is simply the total demand of all consumers combined at that price.
Graphically, the market demand curve is derived through horizontal summation — adding up the quantities demanded by each individual consumer at every price level (not adding up prices).
Worked Example
Suppose two consumers have demand functions d₁(p) = 10 − p and d₂(p) = 15 − p. At any price up to 10, both demand positive quantities, so market demand = (10−p)+(15−p) = 25 − 2p. Between price 10 and 15, only consumer 2 demands anything, so market demand equals 15 − p. Beyond price 15, market demand is zero.
Why This Topic Matters
Understanding how income, related-good prices, and buyer numbers affect demand explains real decisions — from why sugar price hikes hurt tea sales to why premium brands see rising demand during economic booms. Next, we look at how responsive demand is to price changes — elasticity of demand.
Related Reads
Practice These High-Weightage Concepts Today
Normal vs inferior goods, substitutes vs complements, and market demand numericals show up often in CUET and board exams. On ChampionsPrep, get topic-wise practice questions and instant doubt resolution for just ₹10 per use. Visit https://app.championsprep.in and start practicing today.
Test Your Knowledge

Normal vs Inferior Goods, Substitutes & Market Demand (Class 11)
Frequently Asked Questions
What is the key difference between a normal good and an inferior good? +
Demand for a normal good moves in the same direction as the consumer's income (rises when income rises), while demand for an inferior good moves in the opposite direction (falls when income rises).
What makes a Giffen good different from a regular inferior good? +
A Giffen good is a special inferior good where the income effect of a price change is so strong that it outweighs the substitution effect, causing demand to rise as price rises, unlike regular goods.
How does the demand for a good change when the price of its substitute rises? +
Demand for the good increases, since consumers shift away from the now-costlier substitute and buy more of the good in question instead.
What is the difference between a movement along the demand curve and a shift in the demand curve? +
A movement along the curve happens only due to a change in the good's own price, while a shift of the entire curve happens due to changes in income, prices of related goods, or consumer preferences.
How is the market demand curve different from an individual demand curve? +
The market demand curve represents the total quantity demanded by all consumers in the market at each price, derived by horizontally summing the quantities from every individual consumer's demand curve.
AI-powered practice — free to start