
Consumer’s Equilibrium and Deriving the Demand Curve
We’ve covered what a consumer prefers (indifference curves) and what she can afford (the budget line). Now comes the exciting part: combining the two to find the consumer’s best possible choice — a concept called consumer’s equilibrium or the consumer’s optimum. This post also shows how this single idea is used to derive the downward-sloping demand curve you’ll use throughout microeconomics.
The Consumer’s Choice Problem
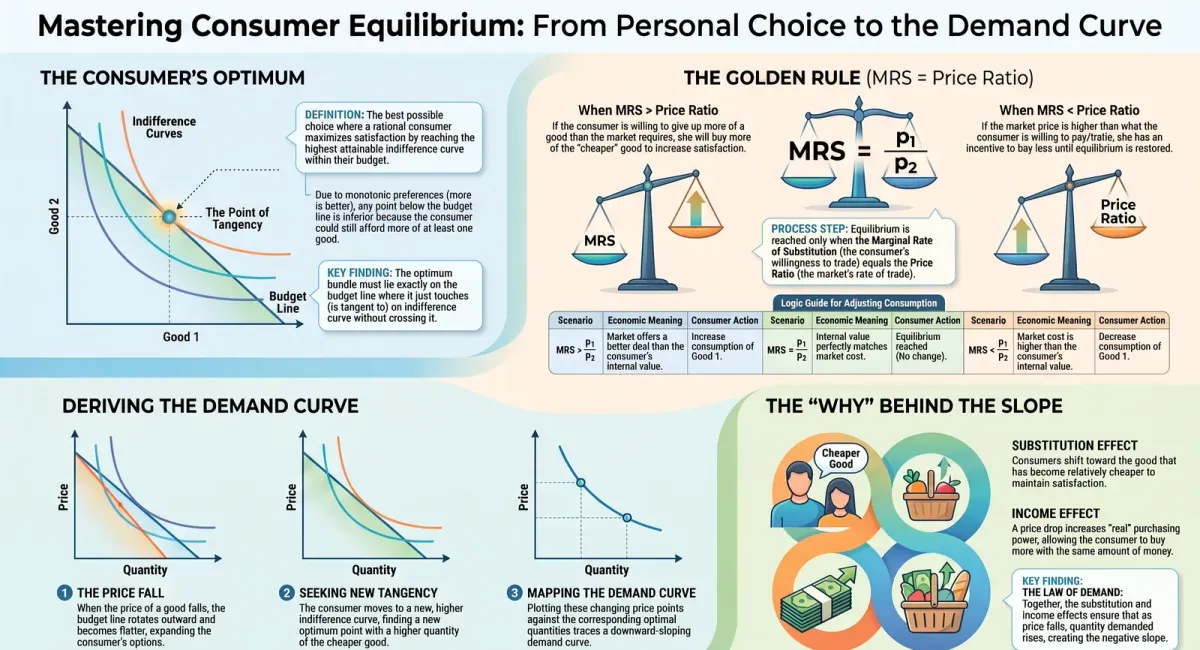
A rational consumer always tries to reach the highest possible indifference curve she can, given her budget constraint. She has well-defined preferences over all bundles and picks the one that maximizes her satisfaction — but only from bundles she can actually afford.
So her problem boils down to this: move to the highest indifference curve possible, without crossing the budget line.
Why the Optimum Bundle Lies on the Budget Line
You might think the consumer should stay well within her means, but that’s actually not optimal. Since preferences are monotonic (more is always better, or at least not worse), any point below the budget line can be improved upon — there’s always a point on the budget line itself that gives more of at least one good, and is therefore preferred.
Points above the budget line, meanwhile, are simply unaffordable. So the optimum bundle must lie exactly on the budget line.
Why the Optimum Is at the Point of Tangency
Among all the points on the budget line, which one is best? It’s the point where the budget line is tangent to an indifference curve — meaning it just touches the curve without crossing it.
Here’s the intuition: any other point on the budget line will fall on a lower indifference curve, making it inferior. Only at the point of tangency does the consumer reach the highest indifference curve that her budget allows. Beyond that point, better bundles simply aren’t affordable.
The Golden Rule: MRS = Price Ratio
At the point of tangency, something mathematically elegant happens: the slope of the indifference curve (MRS) exactly equals the slope of the budget line (the price ratio, p₁/p₂).
MRS = p₁/p₂
Why must this hold true at the optimum? Let’s understand through logic rather than memorization.
-
MRS is the rate at which the consumer is personally willing to trade one good for another, while keeping her satisfaction unchanged.
-
The price ratio is the rate at which the market actually allows her to trade one good for another.
Suppose at some point, MRS = 2 (she’s willing to give up 2 mangoes for 1 more banana) but the price ratio is 1:1 (the market only requires her to give up 1 mango for 1 more banana). Since the market offers a better deal than she’s demanding, she should buy more bananas — she’ll end up with more of both goods in terms of satisfaction, moving to a preferred bundle. This means the original point could not have been the optimum.
This logic works in reverse too: if MRS is less than the price ratio, she should buy less of that good. Only when MRS exactly equals the price ratio does the consumer have no further incentive to adjust her bundle — this is her equilibrium.
Deriving the Demand Curve from Consumer’s Equilibrium
Now here’s where everything comes together beautifully. Suppose a consumer is at her optimum, consuming a certain quantity of bananas at a given price. What happens if the price of bananas falls, while her income and the price of mangoes stay the same?
-
A fall in price makes the budget line flatter, rotating outward around the vertical intercept.
-
This expands her budget set — she now has access to more bundles than before.
-
She finds a new tangency point on a higher indifference curve, where she buys more bananas than before.
If we plot each price against the corresponding optimal quantity of bananas she chooses, we trace out her demand curve — and since a lower price consistently leads to a higher quantity demanded, this demand curve is negatively sloped, confirming the Law of Demand.
Substitution Effect and Income Effect
The negative slope of the demand curve can also be explained through two simultaneous effects when price falls:
Substitution Effect
Bananas become relatively cheaper compared to mangoes, so the consumer substitutes toward bananas to maintain the same satisfaction level.
Income Effect
A price fall effectively increases the consumer’s real purchasing power — even with the same money, she can now buy more — further boosting demand for bananas (and possibly mangoes too).
Together, these two effects reinforce each other for most goods, producing the classic downward-sloping demand curve.
Why This Matters for Board Exams
Questions on consumer’s equilibrium often ask you to explain why MRS must equal the price ratio, or to derive the demand curve using a diagram showing multiple budget lines and indifference curves. The key is to always connect the diagram to the economic logic — examiners reward reasoning, not just memorized statements.
Get Exam-Ready on Consumer’s Equilibrium
This is one of the most diagram-heavy, logic-intensive topics in the chapter — and the fastest way to master it is through targeted practice. On ChampionsPrep, solve topic-wise questions on Consumer’s Equilibrium and get instant doubt resolution for just ₹10 per use. Visit https://app.championsprep.in and strengthen your fundamentals today.
Test Your Knowledge
Interactive Practice: Price Elasticity of Demand (Ed)

Consumer's Equilibrium and Deriving the Demand Curve (Class 11)
Frequently Asked Questions
What is meant by consumer's equilibrium? +
Consumer's equilibrium refers to the point where a consumer selects the bundle of goods that maximizes her satisfaction, given her budget constraint — represented by the point where the budget line is tangent to the highest attainable indifference curve.
Why must MRS equal the price ratio at the consumer's optimum? +
Because if MRS is not equal to the price ratio, the consumer can always rearrange her purchases to reach a more preferred bundle, meaning that point cannot be her true optimum; equality removes any further incentive to change her choices.
Why can't the optimum bundle lie below the budget line? +
Because with monotonic preferences, there is always some point on the budget line itself offering more of at least one good, which the consumer would prefer over any point lying below the line.
How is the demand curve derived from consumer's equilibrium? +
By observing how the optimal quantity demanded changes as the price of a good falls (with income and other prices constant), and plotting each price against its corresponding optimal quantity to trace a downward-sloping demand curve.
What is the difference between the substitution effect and the income effect? +
The substitution effect refers to consumers shifting toward a good that has become relatively cheaper, while the income effect refers to the increase in real purchasing power that results from a lower price, both of which typically increase demand.
AI-powered practice — free to start