
Every macroeconomic model of income determination starts from one simple question: what makes households spend money? The answer lies in the consumption function, one of the most frequently tested topics in CBSE Class 12 Macroeconomics and Commerce entrance exams like CUET and NPAT.
In this post, we’ll break down the consumption function along with four related concepts you must know cold: MPC, MPS, APC, and APS.
What Is the Consumption Function?
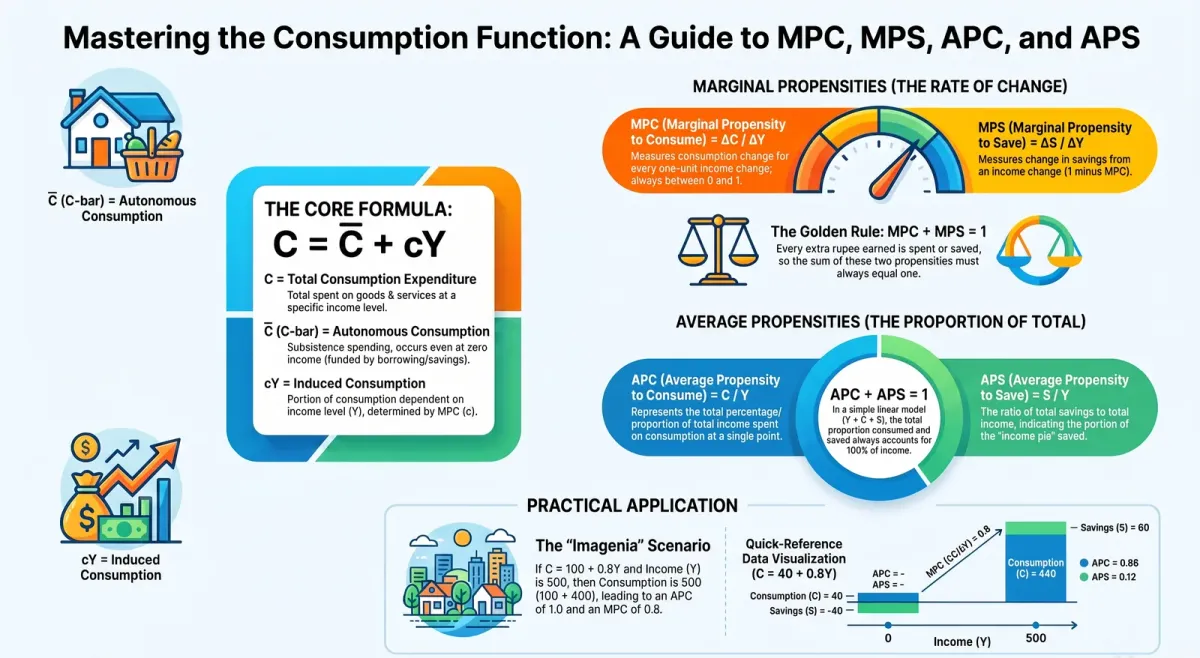
The consumption function describes the relationship between household consumption (C) and income (Y). The simplest version assumes consumption changes at a constant rate as income changes, and is written as:
C = C̄ + cY
Here:
-
C is total consumption expenditure
-
C̄ (C-bar) is autonomous consumption
-
c is the marginal propensity to consume (MPC)
-
cY is induced consumption
This single equation captures two very different ideas about why people spend money, which we’ll unpack below.
Autonomous Consumption vs Induced Consumption
Autonomous consumption (C̄) is the consumption that takes place even when income is zero. Think of it as a subsistence level of spending — people need to eat and survive even without any income, perhaps by borrowing or using savings. Because it doesn’t depend on income, it is called “autonomous.”
Induced consumption (cY), on the other hand, depends entirely on the level of income. As income rises, this component of consumption rises too, at a rate determined by the MPC.
Together, these two components make up total consumption at any given income level.
Marginal Propensity to Consume (MPC)
The marginal propensity to consume, denoted by c, measures how much consumption changes for every one-rupee change in income:
MPC = ΔC / ΔY
For example, imagine a country called Imagenia with the consumption function C = 100 + 0.8Y. Even with zero income, Imagenia’s citizens consume ₹100 worth of goods (autonomous consumption). Its MPC is 0.8, meaning that if income rises by ₹100, consumption will rise by ₹80.
MPC always lies between 0 and 1 (inclusive):
-
If MPC = 0, consumers don’t increase spending at all when income rises.
-
If MPC = 1, consumers spend their entire additional income.
-
Realistically, 0 < MPC < 1, since people typically spend part of extra income and save the rest.
Marginal Propensity to Save (MPS)
Whatever income isn’t consumed is saved. Savings is defined as:
S = Y − C
The marginal propensity to save, denoted by s, measures how much savings change per unit change in income:
MPS = ΔS / ΔY = 1 − c
This gives us one of the most important relationships in this entire chapter:
MPC + MPS = 1
This makes intuitive sense — every extra rupee of income is either spent or saved, so the two propensities must add up to exactly one. In our Imagenia example, since MPC = 0.8, MPS must equal 0.2.
Average Propensity to Consume and Save (APC & APS)
While MPC and MPS look at changes in income, APC and APS look at the total relationship between consumption/savings and income at a given point:
-
APC = C / Y — consumption per unit of income
-
APS = S / Y — savings per unit of income
A common exam mistake is confusing MPC with APC. Remember: MPC is about the rate of change, while APC is about the proportion of total income currently being consumed. Like MPC + MPS, APC and APS also add up to exactly 1: since Y = C + S, dividing both sides by Y gives APC + APS = 1 at every positive income level (check with the worked example below: 0.88 + 0.12 = 1).
Worked Example for Practice
Suppose C = 40 + 0.8Y.
-
If Y = 500, then C = 40 + 0.8(500) = 40 + 400 = 440
-
Savings S = Y − C = 500 − 440 = 60
-
APC = C/Y = 440/500 = 0.88
-
APS = S/Y = 60/500 = 0.12
-
MPC = 0.8 (given), so MPS = 1 − 0.8 = 0.2
Notice that APC (0.88) is different from MPC (0.8) — this is completely normal, since APC includes the effect of autonomous consumption spread across total income, while MPC only measures the response to the last rupee earned.
Why This Topic Matters for Your Exams
The consumption function is not just a standalone topic — it’s the building block for the entire theory of income determination, aggregate demand, and the multiplier, all of which follow directly in this chapter. Board exam papers frequently combine consumption function numericals with multiplier questions, so mastering MPC/MPS/APC/APS early will save you time later.
Related Reading
-
Ex-Ante vs Ex-Post in Economics: Planned vs Actual Values Explained (Class 12)
-
Consumption and Saving Functions Explained: MPC, MPS, APC, APS
Practice Makes Perfect
MPC, MPS, APC, and APS numericals show up in almost every CBSE board paper and Commerce entrance exam. The best way to master them is repeated practice with varied numbers.
👉 Visit ChampionsPrep for topic-wise practice questions, instant AI-powered doubt resolution, and exam-ready notes for Class 11 and 12 Commerce — at just ₹10 per use.
Test Your Knowledge

Consumption Function Explained: MPC, MPS, APC and APS for Class 12 Commerce
Frequently Asked Questions
What is the difference between MPC and APC? +
MPC measures the change in consumption due to a change in income (delta C over delta Y), while APC measures the proportion of total income spent on consumption (C over Y) at a given point.
Can MPC be greater than 1? +
No. Since change in consumption can never exceed the change in income in this basic model, MPC's maximum value is 1.
Why is autonomous consumption called autonomous? +
Because it does not depend on income; it occurs even when income is zero, representing a subsistence level of spending.
How are MPC and MPS related? +
They always add up to 1 (MPC plus MPS equals 1), since every unit of additional income is either consumed or saved.
Is APC always greater than MPC? +
In the simple linear consumption function with positive autonomous consumption, APC is generally greater than MPC at typical income levels, because APC includes the effect of autonomous consumption spread over total income.
Keep practising Economics
AI-powered feedback and structured revision for Economics — free to start, at your own pace.
AI-powered practice — free to start