
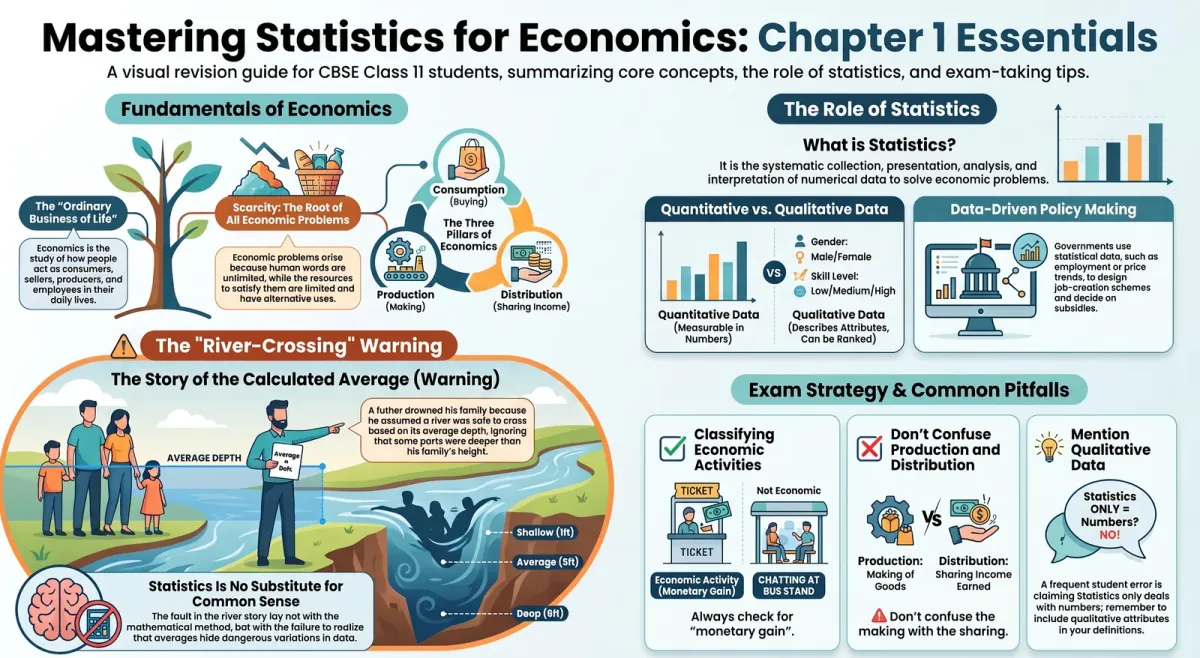
You have now covered the full sweep of Chapter 1 — why economics matters, scarcity and choice, consumption, production, and distribution, and the role of Statistics. This final post ties it together: a crisp recap, a look at the textbook’s memorable river-crossing story, guidance on the NCERT exercises, and a checklist before your exam.
Chapter 1 Recap: Key Concepts to Remember
Before attempting the exercises, it helps to have the chapter’s core ideas fresh in your mind:
-
Economics studies “the ordinary business of life” — everyday activities of consumers, sellers, producers, employees, and employers.
-
Wants are unlimited, resources are limited and have alternative uses — this mismatch, scarcity, is the root of all economic problems.
-
Economics is conventionally divided into consumption (what consumers buy), production (what producers make), and distribution (how income is shared as wages, profits, and interest).
-
Modern economics also studies poverty, unemployment, and income disparity using detailed economic data.
-
Statistics — the collection, presentation, analysis, and interpretation of numerical data — is essential because no economic problem can be solved without reliable facts.
-
Data can be quantitative (measurable in numbers) or qualitative (attributes that can’t be measured exactly, but can be ranked in degrees).
-
Statistics helps condense large datasets, uncover relationships between factors, predict future trends, and design and evaluate policies.
The River-Crossing Story: Why Statistics Is No Substitute for Common Sense
One of the most memorable parts of the chapter is a cautionary story about a family that tried to cross a river. Knowing the river’s average depth, the father calculated his family’s average height and, seeing that it exceeded the river’s average depth, assumed it would be safe to cross. Tragically, this reasoning failed — because an average hides variation. Some family members were shorter than the deepest parts of the river, even though the average height was greater than the average depth.
This story is often asked about directly in exams, and the key insight to remember is this: the fault lies not with the statistical method of calculating averages, but with how the average was applied and interpreted. An average is a useful summary, but it does not tell you about the range or spread of the underlying values. Blindly trusting a single number without applying judgement can lead to serious, even dangerous, mistakes. The takeaway the textbook wants you to carry forward is that statistical methods are powerful tools, but they can never fully replace common sense and careful interpretation.
How to Approach the NCERT Exercises
Chapter 1’s exercises test whether you can apply the concepts above rather than simply recall definitions.
True or false statements about Statistics. Check each statement against the exact scope of the subject — Statistics deals with both quantitative and qualitative data, not quantitative data alone, and cannot solve an economic problem on its own without accompanying data and sound judgement.
Listing and classifying economic activities. For lists drawn from a bus stand, market, or your own household, check each activity for monetary gain. Buying tickets, selling goods, or paying wages count as economic; chatting with a friend while waiting does not.
Illustrating how the government uses statistical data. Pick two concrete examples — such as using employment data to design a job-creation scheme, or price data to decide on subsidies — and briefly explain how data informed each decision.
Explaining unlimited wants and limited resources. Use two examples from your own life (one personal, one shared or family-related) to show how a fixed budget forces a choice between competing wants.
Explaining how you would choose which wants to satisfy, and your reasons for studying Economics. Tie both answers to prioritising the most urgent wants under a limited income, and to how economics explains decisions you already make daily — from pocket money to reading the news.
Commenting on “Statistical methods are no substitute for common sense.” Use the river-crossing story as your central example, plus one of your own — such as trusting an average exam score without checking how spread out the marks actually were.
Common Mistakes Students Make in This Chapter
Even in a conceptual chapter, students lose marks in predictable ways: confusing production (making goods) with distribution (sharing the income earned); treating every activity as “economic” without checking for monetary gain; describing Statistics as dealing only with numbers, forgetting qualitative data; and explaining the river-crossing story vaguely instead of stating that the fault lay in misusing the average, not the method itself.
Quick Revision Checklist Before Your Exam
-
Can you define consumer, seller, producer, employee, and employer with one example each?
-
Can you explain why scarcity is the root of all economic problems?
-
Can you state the three divisions of economics with one example of each?
-
Can you explain quantitative vs qualitative data with fresh examples?
-
Can you explain why the river-crossing story shows statistics is no substitute for common sense?
-
Can you list two ways Statistics supports economic policymaking?
Related Reading on ChampionsPrep
-
Why Study Economics? Meaning and Basic Concepts for Class 11 Students
-
Consumption, Production and Distribution — The Three Pillars of Economics
Start Learning Smarter with ChampionsPrep
Revision is where most marks are won or lost. ChampionsPrep’s AI-powered question banks let you practise exercise-style questions from every NCERT chapter, with instant, exam-ready explanations tailored to CBSE and Maharashtra Board Class 11–12 Commerce students. Registration is free, and you only pay-as-you-use — no subscriptions required. Revise Chapter 1 on ChampionsPrep and walk into your exam fully prepared.
Test Your Knowledge
Statistics for Economics Chapter 1: Exercise Solutions & Exam Tips
Frequently Asked Questions
What is the main lesson of the river-crossing story in Chapter 1? +
The story shows that an average can hide important variation within a dataset. The father's family faced tragedy not because the method of calculating averages was flawed, but because he misapplied the average height figure without considering that some members were shorter than the river's deepest points.
How should I answer 'what are your reasons for studying Economics' in an exam? +
Link your answer to real, personal reasons — such as wanting to understand everyday financial decisions, current economic news, or how resources and choices affect your own life — rather than giving a generic, textbook-style answer.
Is Statistics only about quantitative data? +
No. While much of the data used in economics is quantitative, Statistics also deals with qualitative data — attributes like gender or skill level that cannot be measured exactly but are still recorded and studied systematically.
What is the most common mistake students make in this chapter's exam answers? +
Confusing production with distribution, or treating every activity as economic without checking whether it involves monetary gain, are the two most frequent errors examiners report in this chapter.
How many marks does Chapter 1 typically carry in CBSE Class 11 exams? +
Weightage varies by school and year, but Chapter 1 is primarily tested through short-answer and reasoning-based questions rather than numerical problems, so a clear conceptual understanding matters more than memorising figures.
AI-powered practice — free to start