
Why does a subject about numbers, tables, and averages sit right at the heart of an economics course? Class 11 Statistics for Economics answers this question early on, and the reasoning is simpler than it looks: no economic problem can be properly understood, let alone solved, without reliable facts. This post explains what Statistics actually means as a subject, the two broad types of data economists work with, and the many ways Statistics supports economic analysis and policymaking.
What Is Statistics? Definition and Scope
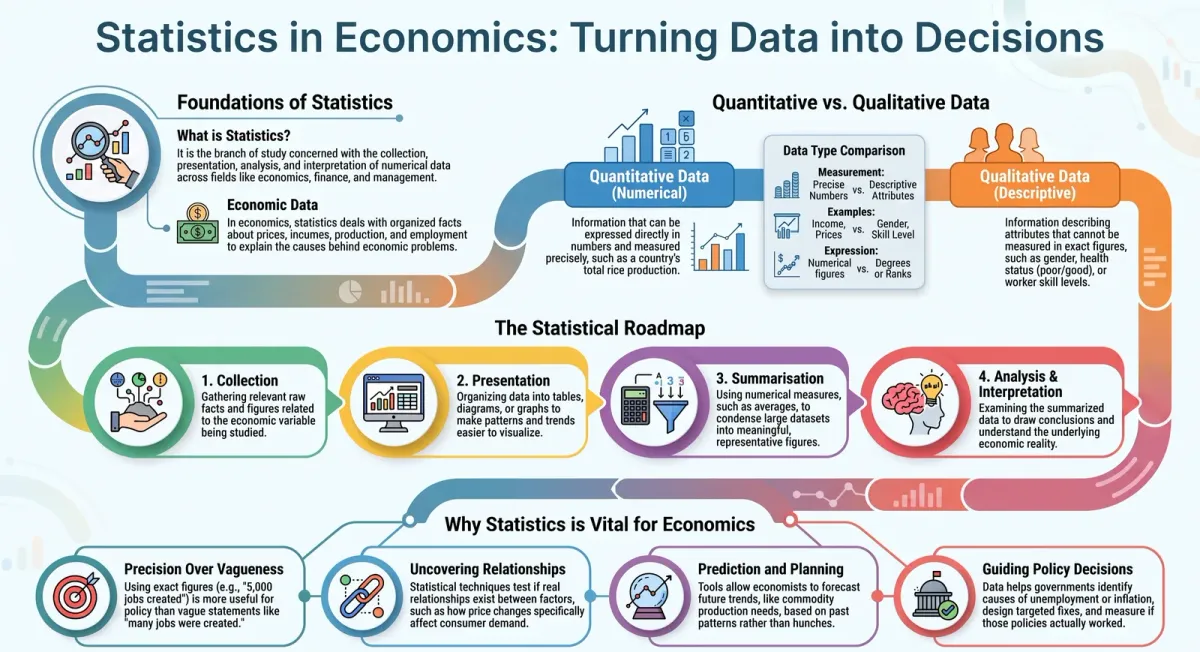
Statistics is the branch of study concerned with the collection, presentation, analysis, and interpretation of numerical data. While it originated as a branch of mathematics, it is now used across many fields — economics, accounting, management, finance, psychology, and sociology, to name a few.
Within economics specifically, Statistics deals with what is known as economic data: organised facts about prices, incomes, production, employment, and similar variables. Collecting this data is only the first step. The real value of Statistics lies in what comes next — presenting the data clearly, summarising it meaningfully, and using it to explain the causes behind economic problems.
Quantitative vs Qualitative Data in Economics
Most of the data economists work with is quantitative — information that can be expressed directly in numbers. A statement such as “the country’s rice production rose from a certain level decades ago to a much higher figure today” is a piece of quantitative data, because it can be measured and compared precisely.
However, economics also relies on qualitative data — information describing attributes or characteristics that cannot be measured in exact numerical terms, even though they matter a great deal. A person’s gender, or a worker’s skill level described as unskilled, skilled, or highly skilled, are examples of qualitative attributes. Such information is still collected and organised systematically, often by ranking it in degrees (for instance, describing health status as poor, average, or good), even though it cannot be expressed as a precise figure the way income or price can.
Recognising this distinction is important because exam questions frequently ask students to classify a given piece of information as qualitative or quantitative — a skill that also matters for the data-handling chapters later in the course.
How Statistics Helps Economists
Statistics is far more than a way of counting things. Within economics, it performs several distinct jobs.
Making economic facts precise. A statement backed by exact figures is always more convincing and useful than a vague one. Saying that a certain number of jobs were created in a sector carries far more weight — and is far more usable for policy — than simply saying “many jobs were created.”
Condensing large amounts of data. No one can remember the individual income of millions of people in a country. Statistics solves this by summarising huge datasets into a handful of meaningful measures, such as averages, that represent the data as a whole.
Uncovering relationships between economic factors. Economists often want to know how one factor affects another — for example, how a change in price affects the quantity of a good people buy, or how a rise in government spending affects the general price level. Statistical techniques allow economists to test whether such relationships genuinely exist in the data, rather than relying on guesswork.
Supporting prediction and planning. Governments and businesses frequently need to plan for the future — deciding, for instance, how much of a commodity to produce or import years in advance. Statistical tools allow economists to base such forecasts on patterns in past and current data, rather than on subjective hunches alone.
Guiding policy decisions. Once the causes of a problem such as unemployment or rising prices are identified using data, it becomes far easier to design targeted policies to address them, and later, to measure whether those policies actually worked.
The Process: Collection, Presentation, and Analysis
Working with statistics in economics generally follows a sequence. First, relevant data is collected. Next, it is presented in an organised form — through tables, diagrams, or graphs — so that patterns become easier to see. The data is then summarised using numerical measures that describe its broad characteristics. Finally, this summarised information is analysed and interpreted to draw conclusions about the underlying economic problem.
This sequence — collection, presentation, summarisation, analysis — is essentially the roadmap for the rest of your Statistics for Economics textbook, with later chapters devoted to each stage in detail.
Why Statistics Is a Vital Tool for Economic Policy
Ultimately, the reason Statistics matters so much to economics comes down to decision-making. Whether a government is deciding how much of a commodity to import, evaluating whether a welfare scheme is working, or trying to understand the true scale of a problem like unemployment, none of these decisions can be made responsibly without dependable data. Statistics turns scattered facts into usable knowledge — and usable knowledge is what allows economic policy to actually solve problems rather than guess at them.
Related Reading on ChampionsPrep
-
Why Study Economics? Meaning and Basic Concepts for Class 11 Students
-
Consumption, Production and Distribution — The Three Pillars of Economics
-
Statistics for Economics Chapter 1: Exercise Solutions & Exam Tips
Start Learning Smarter with ChampionsPrep
Statistics concepts like data types, averages, and interpretation carry forward into every later chapter of this course — and into entrance exams like CUET Commerce. ChampionsPrep’s AI-powered platform gives you chapter-wise practice questions with instant explanations, so weak spots get caught early. Registration is free, and you only pay-as-you-use. Get started on ChampionsPrep and build a strong statistics foundation from Chapter 1 itself.
Test Your Knowledge
Role and Importance of Statistics in Economics (Class 11)
Frequently Asked Questions
What is the definition of Statistics used in Class 11 Economics? +
Statistics is defined as the branch of study dealing with the collection, analysis, interpretation, and presentation of numerical data, used across disciplines including economics, accounting, and finance.
What is the difference between quantitative and qualitative data? +
Quantitative data can be measured and expressed precisely in numbers, such as income or production figures. Qualitative data describes attributes that cannot be measured exactly, such as gender or skill level, though it can often be expressed in degrees.
How does Statistics help economists study relationships between factors? +
Statistical techniques allow economists to test whether a relationship genuinely exists between two economic factors, such as price and demand, rather than assuming it based on guesswork alone.
Why is Statistics important for government policymaking? +
Governments need reliable data to identify the causes of economic problems, design suitable policies to address them, predict future trends, and later evaluate whether those policies were effective.
What are the main steps involved in using Statistics in economics? +
The typical process involves collecting data, presenting it in tabular or graphical form, summarising it using numerical measures, and finally analysing and interpreting it to draw meaningful conclusions.
AI-powered practice — free to start