
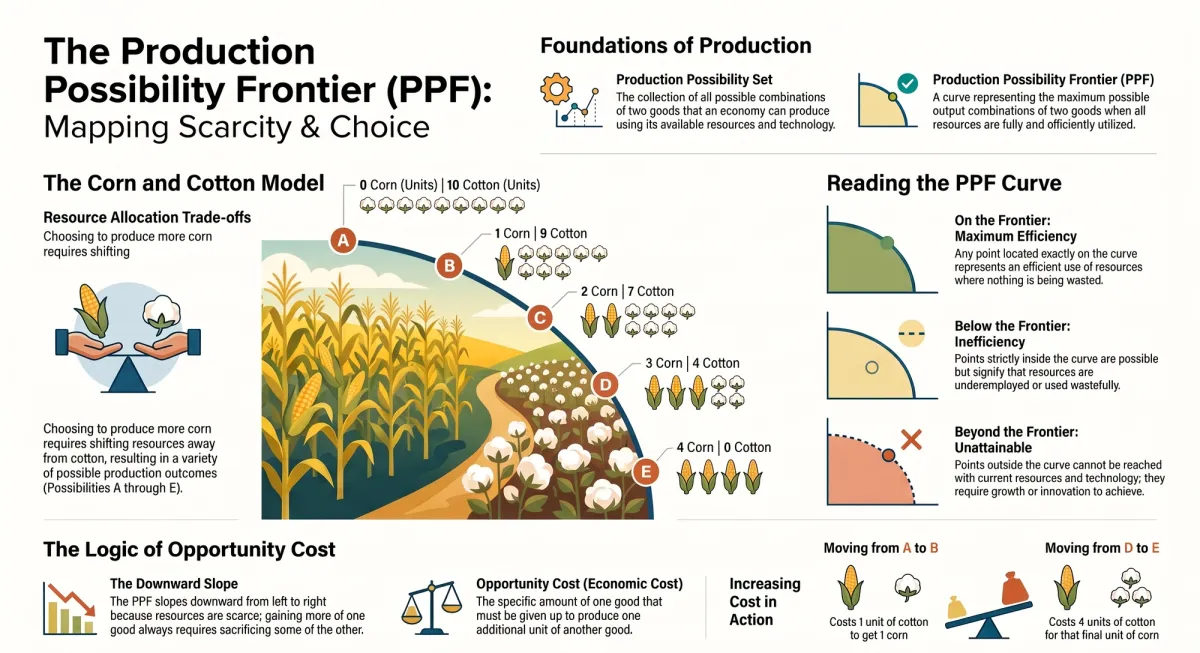
If economics had a single diagram that captured its most fundamental ideas — scarcity, trade-offs, opportunity cost, efficiency, and growth — it would be the Production Possibility Curve (PPC).
For CBSE Class 12 students, the PPC is one of the most heavily tested topics in microeconomics. For anyone studying economics, it is the visual language through which economists discuss what economies can and cannot do, and what it costs to do more of one thing.
What Is the Production Possibility Curve?
The Production Possibility Curve (PPC) shows all possible combinations of two goods that an economy can produce, given:
-
A fixed amount of resources (land, labor, capital, technology)
-
Full and efficient utilization of those resources
-
Given technology — no improvements assumed
Think of it as a boundary: the PPC traces the outer limit of what an economy is capable of producing. Inside that boundary lies what is being produced; outside it lies what is currently impossible.
Simple Analogy: Imagine your monthly budget is ₹10,000. The PPC for your spending shows all combinations of, say, food and clothing you can buy with exactly ₹10,000. Spend more on food, you must spend less on clothing — and vice versa.
Key Features of the PPC
Feature 1: Downward Sloping
The PPC slopes downward from left to right. This means producing more of one good requires producing less of the other.
This is a direct consequence of scarcity. Resources are limited — if you redirect them toward producing Good X, fewer resources are available for Good Y. You cannot increase production of both goods simultaneously without additional resources.
On the diagram: As you move along the curve from top-left to bottom-right, the quantity of Good Y decreases while Good X increases.
Feature 2: Concave to the Origin (Bowed Outward)
This is the most examined feature of the PPC — and the one students most commonly get wrong by drawing it convex instead.
The PPC is concave to the origin (bowed outward), meaning it curves away from the center. This shape reflects the principle of increasing opportunity cost — also called increasing Marginal Rate of Transformation (MRT).
Why Does Opportunity Cost Increase?
Because resources are not equally efficient at producing all goods.
When an economy first starts transferring resources from Good Y to Good X, it shifts the resources that are relatively better suited for X — they produce a lot of X for a small sacrifice of Y. But as the transfer continues, it must shift resources that are less suited for X and better suited for Y. These resources produce less X per unit transferred, and each sacrifice of Y yields diminishing amounts of X.
Result: Each successive unit of Good X requires a larger sacrifice of Good Y — opportunity cost increases as you produce more X. This increasing sacrifice gives the PPC its outward-bowed shape.
Contrast: If resources were equally efficient for both goods (perfectly substitutable), the PPC would be a straight line — constant opportunity cost. This is a theoretical special case, rarely realistic.
Feature 3: Points On, Inside, and Outside the Curve
Every point relative to the PPC has a specific economic interpretation — and this is a guaranteed exam topic.
Points ON the PPC
The economy is achieving full employment and efficient utilization of all available resources. It is producing at its maximum potential — no waste, no idle capacity.
Points INSIDE the PPC (Below the Curve)
The economy is underperforming — resources are either:
-
Unemployed (workers without jobs, land not in use, capital sitting idle)
-
Inefficiently used (resources employed but not producing their maximum possible output)
A country experiencing high unemployment, outdated technology adoption, or poor resource organization will operate inside its PPC. There is untapped productive potential.
Points OUTSIDE the PPC (Beyond the Curve)
Currently unattainable — the economy cannot reach these points with its existing resources and technology. These points would require either more resources or better technology than currently available.
They are not impossible forever — only currently beyond reach. Economic growth moves the PPC outward, eventually making formerly unattainable points achievable.
| Point Position | Meaning | Example Cause |
|---|---|---|
| On the PPC | Full employment, efficient production | Optimal resource use |
| Inside the PPC | Unemployment or inefficiency | Recession, poor management |
| Outside the PPC | Currently unattainable | Insufficient resources/technology |
Marginal Rate of Transformation (MRT)
The Marginal Rate of Transformation (MRT) measures the slope of the PPC at any given point. It tells you how much of Good Y must be sacrificed to produce one additional unit of Good X.
Formula
MRT = ΔY ÷ ΔX
Where:
-
ΔY = Change in quantity of Good Y (the good being sacrificed)
-
ΔX = Change in quantity of Good X (the good being gained)
What MRT Tells Us
-
Low MRT (flat section of PPC): A small sacrifice of Y yields significant gain in X — resources are well-suited to producing X at this point
-
High MRT (steep section of PPC): A large sacrifice of Y yields little gain in X — resources are poorly suited to producing X here
On a standard concave PPC, MRT increases as you move along the curve and produce more of Good X — which is precisely what creates the concave shape.
Numerical Example
| Good X Produced | Good Y Produced | ΔX | ΔY | MRT (ΔY/ΔX) |
|---|---|---|---|---|
| 0 | 100 | — | — | — |
| 10 | 95 | 10 | 5 | 0.5 |
| 20 | 85 | 10 | 10 | 1.0 |
| 30 | 70 | 10 | 15 | 1.5 |
| 40 | 50 | 10 | 20 | 2.0 |
Each additional 10 units of Good X costs more Good Y — increasing MRT, confirming the concave shape.
Shifts in the PPC
The PPC is drawn assuming fixed resources and technology. When either changes, the entire curve shifts.
Rightward (Outward) Shift — Economic Growth
The economy’s productive capacity increases, making previously unattainable points now achievable.
Causes of outward shift:
-
Improvement in technology — same resources now produce more output
-
Increase in labor force — population growth or immigration adds productive capacity
-
Capital accumulation — investment in new machinery, infrastructure, and equipment
-
Improved education and skills — a more skilled workforce is more productive
-
Better resource allocation — using existing resources more effectively
What an outward shift means: Economic growth. The country can now produce more of both goods than before — the constraint has expanded.
Leftward (Inward) Shift — Economic Decline
The economy’s productive capacity decreases.
Causes of inward shift:
-
Natural disasters — earthquakes, floods, droughts destroy productive capacity
-
War and conflict — infrastructure destruction, workforce casualties
-
Resource depletion — exhaustion of non-renewable resources
-
Emigration of skilled workers — “brain drain” reduces human capital
-
Prolonged neglect of infrastructure — deterioration of productive assets
Rotation (Asymmetric Shift)
If technology improves for only one good — not both — the PPC rotates rather than shifting parallel.
Example: Better agricultural technology increases farming productivity but not industrial production. The PPC rotates outward on the agricultural axis while the industrial axis endpoint remains unchanged. The new PPC is steeper on one end, reflecting the asymmetric improvement.
| Change | Effect on PPC |
|---|---|
| Technology improves for both goods | Parallel outward shift |
| Technology improves for one good only | Rotation toward that good's axis |
| Resources increase (e.g., population) | Parallel outward shift |
| Natural disaster | Inward shift |
Common Exam Mistakes to Avoid
Drawing the PPC convex instead of concave: The PPC must bow outward (concave to the origin), not inward. A convex curve would imply decreasing opportunity cost — which contradicts the fundamental assumption of increasing MRT.
Forgetting to label axes: Always label both axes with the names of the two goods being analyzed. Unlabeled diagrams lose marks.
Confusing “inside” and “outside” interpretations: Inside = inefficiency/unemployment (attainable but wasteful). Outside = unattainable (not currently possible).
Applying MRT formula incorrectly: MRT = ΔY/ΔX — the good being sacrificed in the numerator, the good being gained in the denominator.
Key Takeaway
The PPC is more than a diagram — it is a visual model of scarcity, trade-offs, efficiency, and growth. Its downward slope captures the unavoidability of trade-offs. Its concave shape captures increasing opportunity cost. The space inside it represents waste; the space outside it represents aspiration. Shifts in it represent progress or decline.
Master the PPC, and you have mastered the visual language of economics.
Related Posts:
-
Introduction to Economics: Scarcity, Choice & Opportunity Cost Explained
-
Three Central Problems of Every Economy: What, How & For Whom to Produce
-
Economic Systems: Market Economy, Command Economy & Mixed Economy Compared
Keep practising Economics
AI-powered feedback and structured revision for Economics — free to start, at your own pace.
AI-powered practice — free to start